Lighting for streets, roadways, parking lots, and general outdoor areas is now rapidly switching from traditional high-pressure sodium (HPS) and metal halide (MH) light sources to arrays of high-power white LEDs. This switch is due to the technology’s promises for lower energy use, longer life, better color rendering, and acceptance of controls. Differences between the sources include: spectral power distribution (SPD), source luminance, beam intensity distribution, and the number of sources needed to achieve intended light levels. As LED sources are becoming more widely used, there is anecdotal evidence that certain populations believe LED streetlights and area lights to produce more glare than HPS luminaires.
Research in the areas of vehicle headlamp design and outdoor lighting has shown that light sources with a SPD having a greater amount of short-wavelength content, such as the phosphor-converted white LEDs, may produce more discomfort glare than light sources with more long-wavelength content, such as traditional outdoor lighting technologies. In recent years, there has been increased use of high intensity discharge (HID) headlamp technologies in the automotive industry, replacing traditional halogen sources. Compared to halogen headlamps, HID sources have increased luminance, and increased short wavelength content. When the automobile industry introduced HID headlamps in the United States and received complaints from drivers about glare from the new car headlamps, it was unclear which of these factors (luminance or SPD) made the greatest contribution to observers’ perceptions of discomfort glare from oncoming headlamps
Studies have shown that light source SPD has a strong effect on discomfort glare ratings. Discomfort glare is one of two primary types of glare, the other being disability glare. Discomfort glare is identified by complaints or annoyance of observers when a bright light source is introduced into their field of view, and is typically measured subjectively using the de Boer scale. Flannagan et al. (1989) looked at a range of six narrow band sources and found the highest de Boer ratings (i.e. least amount of discomfort) were seen with the 577 nm stimulus, while the lowest ratings (i.e. greatest amount of discomfort) were recorded with the 480 nm stimulus.
Short wavelength sensitive (SWS) cones in the retina have an input into certain pathways in the brain that transfer wavelength discrimination information, which Fotios and Levermore describe as an “ancient subsystem of colour vision”. This might explain some effects of chromaticity on brightness perception. Bullough et al. (2002) plotted recorded discomfort glare ratings as a function of the relative short-wavelength sensitive cone illuminance. There was a very high correlation (r2 = 0.974) between discomfort ratings and the relative SWS cone illuminances. Subsequently, Bullough (2009) proposed a discomfort glare sensitivity function, VDG(λ), for nearly monochromatic light viewed from 5° and 10° off axis, based on data from Dee (2003), having the form:
VDG(λ) = V10(λ) + kS(λ) (Equation 1)
In this formula, k is a scaling factor adjusted to find the best fit, and S(λ) is a luminous efficiency function for the SWS cone (having a maximum value of 1 at 440 nm).

Plotted above is a discomfort glare luminous efficiency function for nearly monochromatic light sources located at 5°. This function could be used to make predictions of discomfort glare from light sources with various SPDs.
This study was designed to evaluate the impact of different luminous surround SPDs on subjective ratings of discomfort glare from a white light LED array. The IESNA lighting handbook recommends a minimum horizontal illuminance of 2 lx in parking lots, with a minimum of 5 lx for increased security parking lots. At these light levels, illuminances between 5 and 25 lx at the eye could be expected. The direct illuminances from the white light LED array were set to 4, 6, 8, 10, and 12 lx at the eye. The direct illuminances from the LED array were combined with three different colored luminous surrounds (blue, yellow and white), as well as a dark surround (not luminous), for a total of 20 conditions. At the lowest setting of 4 lx from the LED array, the colored luminous surrounds (blue, yellow or white) each contributed 3 lx, or 42% of the light reaching the eye (a total of 7 lx). At the highest setting of 12 lx from the LED array, the colored luminous surround contribution of 3 lx made up 20% of the light reaching the eye (a total of 15 lx). The dark surround (0 lx) did not contribute any additional light to the total light from the LED array.
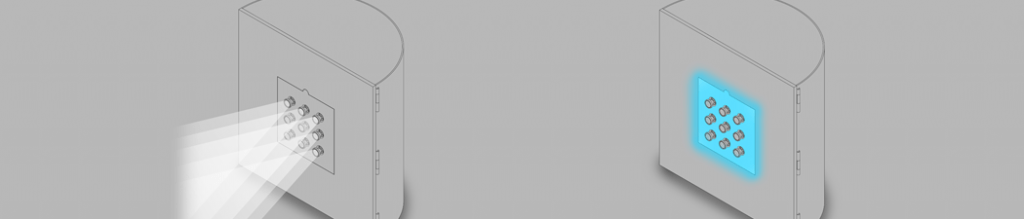
The experimental apparatus was a half-cylindrical light box that acted as an integrating chamber. The luminous area surrounding the white light LED array was created by red, green, and blue LEDs on the inside of the half-cylinder. The yellow luminous surround condition was created by mixing red and green LEDs, while the white luminous surround condition was created by using phosphor-converted white LEDs . The light was seen through a diffusing acrylic sheet mounted in the face of the apparatus. The white light LED array, which acted as the glare source for this experiment, was composed of nine white LEDs each fitted with a 10° beam lens, and mounted directly into the diffusing sheet so that the luminous surround light glowed uniformly around and between the LED array.
Protocol
The experiment was conducted in a dark, windowless laboratory. Subjects sat in a chair and were asked to rest their chins on a chin rest. The chin rest, located 3 m away from the apparatus, ensured that subjects’ eyes were located at the same height as the center of the LED array. Subjects were asked to fixate on the LED array. Each subject was tested individually and was allowed to hold a printed sheet showing the de Boer discomfort glare rating scale to use as a reference. Each LED array and luminous surround combination was presented in random order to each subject, and each subject saw a different order than any other subject. For each condition, the subject rated his or her discomfort using the de Boer scale. Once the subject rated the condition, the apparatus was covered with an opaque shield for a period of 6 to 10 seconds while the experimenter switched to the next lighting condition. This process was repeated until all conditions were presented.

Mean de Boer ratings (± standard error of the mean) for the different experimental conditions in the experiment
The results from the experiment are presented in the figure above. The increasing illuminance levels of the LED array glare source are noted along the x-axis, while the y-axis plots the de Boer rating values, with 1 being the most glaring (unbearable) and 9 being the least glaring (unnoticeable). As would be expected, the results show that perception of discomfort glare increases with the illuminance levels at the eye, from the glare source. The results also show that there was a significant (p<0.05) decrease in glare perception when a luminous surround (blue, yellow or white) was added to the LED array (for the experimental geometry used and a 3 m distance). No significant difference was found between the yellow and white luminous surround conditions; however, a significant difference was found between the yellow and blue luminous surrounds (p<0.05). The blue luminous surround condition was rated as being more glaring than the white or yellow surround conditions (but still significantly less glaring than the dark non-luminous surround condition).
The results of this experiment confirmed that the perception of discomfort glare from an LED array can be decreased with the addition of a luminous surround. In this study, all three of the luminous surround conditions (blue, yellow and white) showed a decrease in discomfort glare perception as compared with the dark non-luminous surround condition. Additionally, it was found that in certain cases the discomfort glare rating for the blue luminous surround condition, was worse (rated as producing more glare) than the white or the yellow luminous surround conditions, as discussed previously, short-wavelength-sensitive (SWS) cones have been associated with brightness responses.
Weale (1953) investigated extrafoveal perception of color and brightness. An initial study looking at different retinal eccentricities, showed an increased sensitivity to short wavelengths with increasing eccentricity. The work of Weale (1953), in conjunction with the discomfort glare spectral sensitivity functions proposed by Bullough (2009) point to the SWS cone response as a potential explanation for the discomfort glare responses from this experiment, assuming discomfort glare could be explained as an excess of brightness. The SPDs of each luminous surround condition were convolved with the discomfort glare luminous efficiency function (see Equation 1) to develop a relative predicted glare response for that condition, where the value of k in Equation 1 was set as a free parameter (see below for graph).

Mean de Boer ratings (± standard error of the mean) for the experimental conditions plotted as a function of discomfort-glare-weighted illuminance, based on VDG (λ) and with a value for k of 0.13. Also shown is the best-fitting logarithmic function.
A possible application of the results from this study, is in headlamp design, where issues of glare could be overcome by adding a luminous surround to a headlight system that utilizes an LED array or HID lamp. This type of design would create a wash of white light directly from the LED array to illuminate the way for the vehicle, however, to oncoming traffic or pedestrians, the source itself could appear to have a yellow, blue, or white surround, making the array appear less glaring.
*based on my thesis research topic with guidance from : N Narendran PhD, JD Bullough PhD, JP Freyssinier MS.
Also thanks to Martin Overington and Terence Klein for their assistance with experimental setup