Chromograms are created by mapping words to colors, in order to visualize long sequences of text
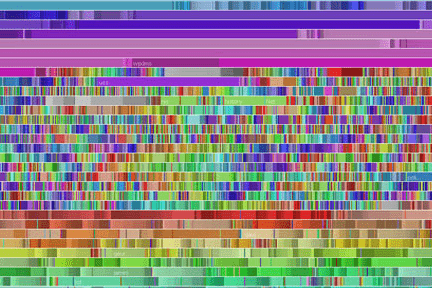
In this beautiful example of data visualization, Fernanda Viégas, Martin Wattenberg and Kate Hollenbach, used this technique to study the editing activity of Wikipedians.